# 코드잇 데이터 사이언티스트 강의 듣는 중
<그룹 별로 분석하기>
- .groupby()
- 같은 그룹끼리 묶어서 값 비교 가능
- 넷플릭스에서 장르 별로 값을 비교 하고 싶을때
netflix_df = pd.read_csv('data/netflix.csv')
netflix_df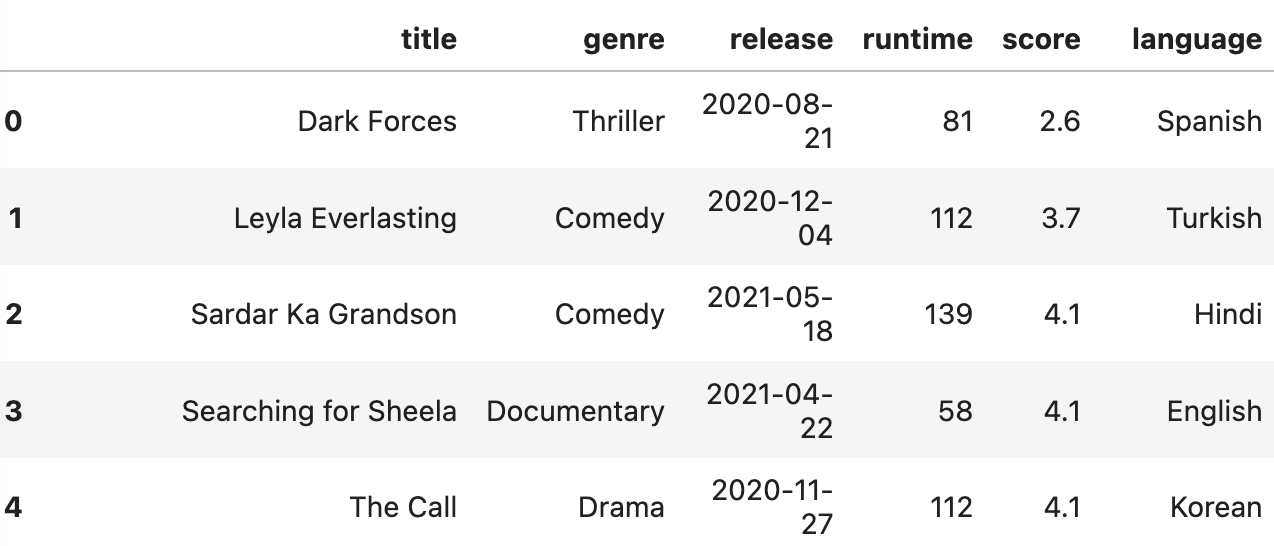
--> 이런 데이터임
- 일단 결측치랑 간단한 통계 값 확인
#일단 결측치부터 확인
netflix_df.info()

# 간단한 통계 값도 확인
netflix_df.describe()
- 장르별로 구분되도록 나누기 --> 뒤에 계산식을 넣지 않으면 groupby가 적용되었다고만 나타남.
netflix_df.groupby('genre')

#값
<pandas.core.groupby.generic.DataFrameGroupBy object at 0x15122e210>
- 장르별 값 확인
netflix_df.groupby('genre').count() #결측 값 제외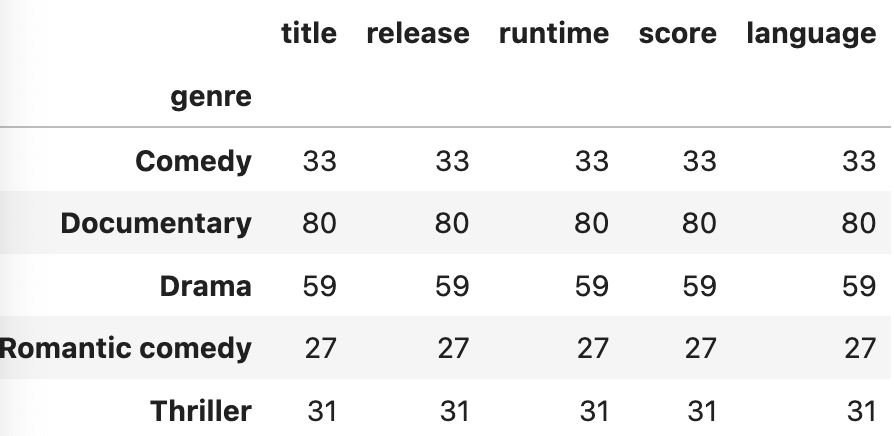
--> .count()
--> 결측 값이 제외되기 때문에 각 칼럼 별로 값이 나타나는 데이터 프레임 형태
netflix_df.groupby('genre').size() #결측 값 포함
--> .size()
--> 결측 값이 포함되기 때문에 하 번에 시리즈로 나타냄
- 최소값 확인
netflix_df.groupby('genre').min()
--> 문자데이터의 최소값은 오름차순으로 정렬 시 가장 첫번째로 오는 값.
--> title 보면 다 알파벳 a로 시작.
netflix_df.groupby('genre').min(numeric_only= True) #숫자 데이터만을 비교해줌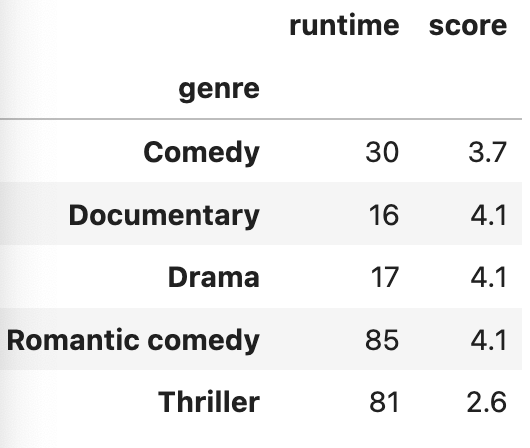
--> numeric_only = True 파라미터를 넣어주면 숫자 데이터만 나타남.
- 최대값/ 평균값/ 합산 값 확인
# 최대값
netflix_df.groupby('genre').max(numeric_only= True)

# 평균값
netflix_df.groupby('genre').mean(numeric_only= True)

# 합산값
netflix_df.groupby('genre').sum(numeric_only= True)
- 특정 벡터만 확인하고 싶으면, 변수명을 인덱싱해주면 됨.
netflix_df.groupby('genre')['score']

#값
<pandas.core.groupby.generic.SeriesGroupBy object at 0x15102e950>
Selection deleted
- 이후에는 위와 똑같이 계산 메소드들을 적용해주면 됨.
netflix_df.groupby('genre')['score'].mean()

#값
genre
Comedy             5.518182
Documentary        6.941250
Drama              6.267797
Romantic comedy    5.722222
Thriller           5.687097
Name: score, dtype: float64
- 인덱싱할 때 원하는 벡터 이름들 리스트로도 가능함.
- 인덱싱 위치가 .mean() 앞임
import pandas as pd

olympic_df = pd.read_csv('data/olympic.csv')

olympic_df.groupby('sport')[['height', 'weight']].mean()
<category 데이터 타입 다루기>
- pd.Categorical()
- 범주형 데이터를 표현할 때 pandas에서는 category 데이터 타입을 사용함.
- 예, 옷 사이즈; XS/S/M/L/XL, 연령대; 10대/20대/30대/40대 등
- 기본적으로 pandas는 범주형 데이터를 가지고 올 때 object를 사용함.
- category는 메모리 사용량이 적고, 각 범주에 순서를 매길 수 있음.
- object로 쓰여진 범주형 데이터
import pandas as pd

clothes_df = pd.DataFrame({
        'size': ['L', 'S', 'XS', 'L', 'S', 'XL', 'L', 'S', 'M', 'XS',
             'M', 'M', 'XS', 'L', 'XL', 'XS', 'M', 'S', 'L', 'XL'],
    'sales': [130, 200, 120, 120, 140, 160, 190, 90, 110, 100,
              150, 180, 100, 200, 80, 140, 150, 90, 80, 130]
})

clothes_df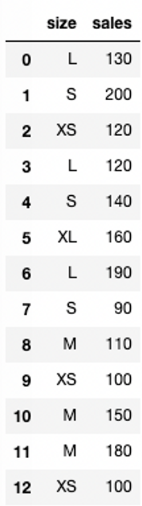
--> 다 섞여 있음.
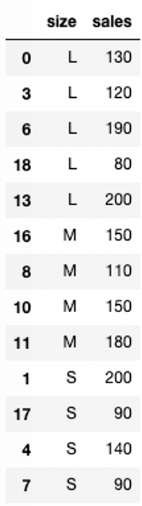
--> 사이즈를 기준으로 오름차순 정렬을 하면,
사이즈가 아닌 알파벳 순서로 나옴.
--> L/M/S/XL/XS
#groupby
clothes_df.groupby('size').mean()

#plot 그림
import seaborn as sns

sns.barplot(data=clothes_df, x='size', y='sales')
--> groupby나 plot를 그려도 순서는 알파벳순으로 나타남.
- category로 쓰여진 범주형 데이터
- pd.Categorical()
- 파라미터로 (바꿀 데이터, ordered = True, categories = ['원하는 순서대로'])
pd.Categorical(clothes_df['size'], ordered=True, categories=['XS', 'S', 'M', 'L', 'XL'])

#값
['L', 'S', 'XS', 'L', 'S', ..., 'XS', 'M', 'S', 'L', 'XL']
Length: 20
Categories (5, object): ['XS' < 'S' < 'M' < 'L' < 'XL']

#저장
clothes_df['size'] = pd.Categorical(clothes_df['size'],
                                    ordered=True,
                                    categories=['XS', 'S', 'M', 'L', 'XL'])

#size를 기준으로 오름차순 정렬
clothes_df.sort_values(by='size')
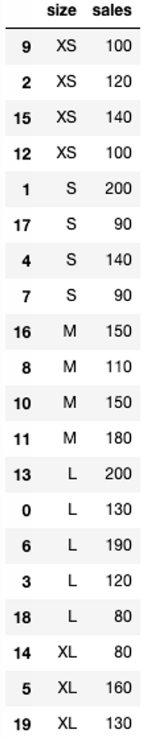
--> 이러면 사이즈 순서로 정렬이 됨.
---> groupby, barplot 등등에도 다 적용됨.
<그룹 별로 멀티 인덱스 >
- .groupby()
- 여러 인덱스를 동시에 비교 가능
- 예시, 넷플릭스의 장르와 발매연도를 한 번에 보고 싶으면,
- 우선 release를 datetime으로 타입을 변화시켜야 함.
pd.to_datetime(netflix_df['release'])

#값
0     2020-08-21
1     2020-12-04
2     2021-05-18
3     2021-04-22
4     2020-11-27
         ...
225   2021-03-24
226   2020-10-14
227   2019-10-23
228   2020-12-08
229   2020-10-04
Name: release, Length: 230, dtype: datetime64[ns]
- 연도만 따로 빼서 변수로 만들어줌.
- .dt 빼먹으면 에러 뜸.
netflix_df['year'] = pd.to_datetime(netflix_df['release']).dt.year

netflix_df
--> year가 추가됐음.
- 데이터 타입을 확인하면, int로 나타남.
netflix_df.dtypes

#값
title        object
genre        object
release      object
runtime       int64
score       float64
language     object
year          int32
dtype: object
- groupby 타입으로 바꿔줌.
netflix_df.groupby(['genre', 'year'])

#값
<pandas.core.groupby.generic.DataFrameGroupBy object at 0x151234510>
- 리스트로 넣어주면 계산 값 확인 가능
- 그룹바이를 할 때 어떤 벡터를 먼저 넣어주는 지에 따라서 형태가 달라짐.
netflix_df.groupby(['genre', 'year']).mean(numeric_only = True)
--> genre를 먼저 넣어줬으니까, genre가 인덱스가 됨.
- 순서를 바꾸면, 인출 값도 바뀜.
netflix_df.groupby(['year','genre']).mean(numeric_only = True)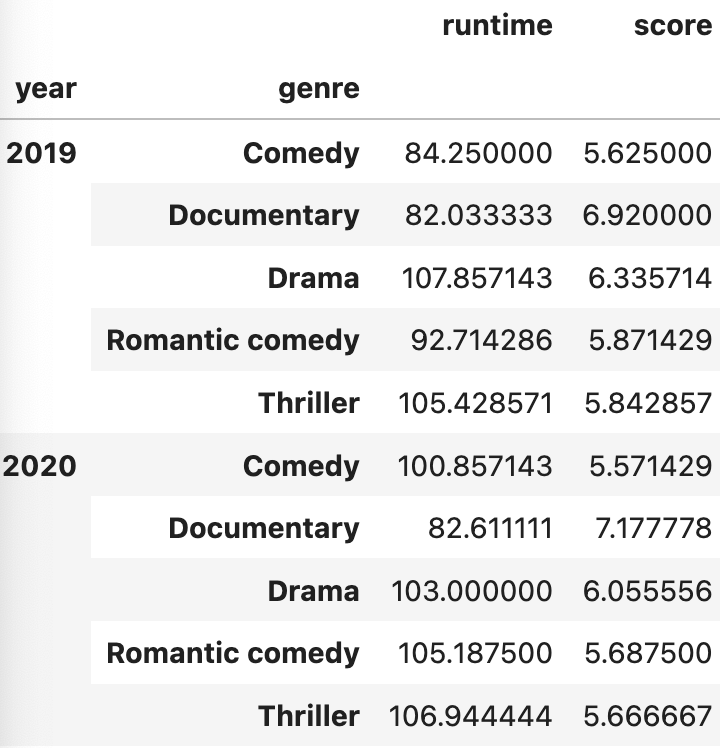
--> 인덱스가 year이 됨.
--> 특정 그룹에 해당되는 경우만 다시 인덱싱을 할 수도 있음.
- 만약에 2020년도의 평균만 알고 싶다면,
netflix_df.groupby(['year','genre']).mean(numeric_only = True).loc[2020,:]

#,:을 제외해도 위와 값이 같음.
netflix_df.groupby(['year','genre']).mean(numeric_only = True).loc[2020]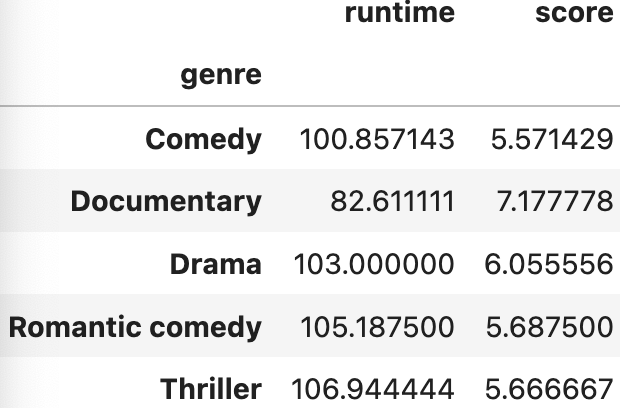
--> 2020년도의 장르별 숫자 데이터의 평균을 확인 가능.
- 만약에, 드라마를 기준으로 알고 싶다면,
netflix_df.groupby(['year','genre']).mean(numeric_only = True).loc['Drama']

#값
KeyError: 'Drama'
--> 이러면 키 에러 뜸. ; 인덱싱을 하려는 데 값이 없어서 에러가 난 것을 의미.
--> 가장 왼쪽의 인덱스를 기준으로 찾는 데 현재는 year가 인덱스임.
- so, 인덱스와 찾을 값을 같이 넣어줘야 함.
netflix_df.groupby(['year','genre']).mean(numeric_only = True).loc[2020, 'Drama']

#값
runtime    103.000000
score        6.055556
Name: (2020, Drama), dtype: float64
- 만약에, 드라마랑 코메디를 둘 다 알고 싶으면,
netflix_df.groupby(['year','genre']).mean(numeric_only = True).loc[(2020, ['Drama', 'Comedy'])]

#값
KeyError: "None of [Index(['Drama', 'Comedy'], dtype='object')] are in the [columns]"
--> 이렇게 하면 x
--> 조건만 넣어준 것이고, 형태가 맞지 않음.
- so, 튜플 안에 리스트를 넘겨줄 땐 ,: 을 써서 앞이 인덱스를 뒷부분이 칼럼을 의미하는 것으로 구분해 줘야 함.
netflix_df.groupby(['year','genre']).mean(numeric_only = True).loc[(2020, ['Drama', 'Comedy']), :]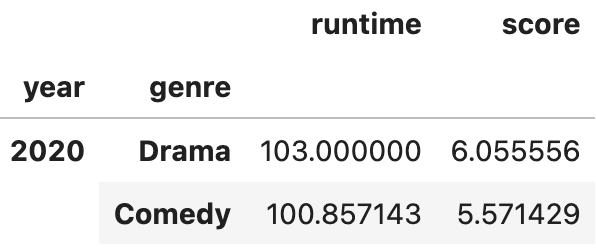
--> 즉, 행의 조건으로 지정해주고, 열 전체에서 가지고 온다는 의미.
- 연도 별로 다 가지고 싶으면, 리스트도 가능
netflix_df.groupby(['year','genre']).mean(numeric_only = True).loc[([2019, 2020, 2021], 'Drama'), :]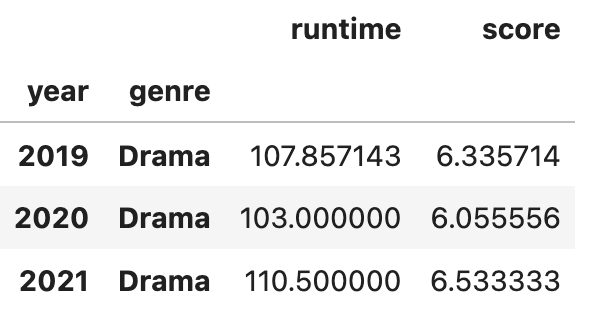
--> 다만, 모든 값을 전부 넣어주는 것은 리스트가 길어지면 불가능해짐.
- so, 변수 year 에 넣어줌.
- 일단 unique()로 값 확인후 정렬이 되어 있지 않기에,
- 정렬 시켜줌. sorted()
netflix_df['year'].unique()

#값
array([2020, 2021, 2019], dtype=int32)


#정렬시키기
years = sorted(netflix_df['year'].unique())
- groupby에 변수를 넣어 줄 때는 ,: 를 넣어주지 않아도 됨.
netflix_df.groupby(['year','genre']).mean(numeric_only = True).loc[(years, 'Drama'), :]
--> 이렇게 하면 연도를 모두 리스트 업해서 일일이 쓸 필요가 없어짐.
<한 번에 여러 개 통계 값 확인하기>
- .agg()
- 여러 연산을 동시에 계산할 수 있음.
- 하나만 하는 것도 인덱싱을 해서 가능함.
- 파라미터로 연산 종류를 넣어주면 됨.
netflix_df.groupby('genre')['score'].agg('mean')

#값
genre
Comedy             5.518182
Documentary        6.941250
Drama              6.267797
Romantic comedy    5.722222
Thriller           5.687097
Name: score, dtype: float64
- 여러 연산 동시에 가능.
netflix_df.groupby('genre')['score'].agg(['mean', 'max', 'min'])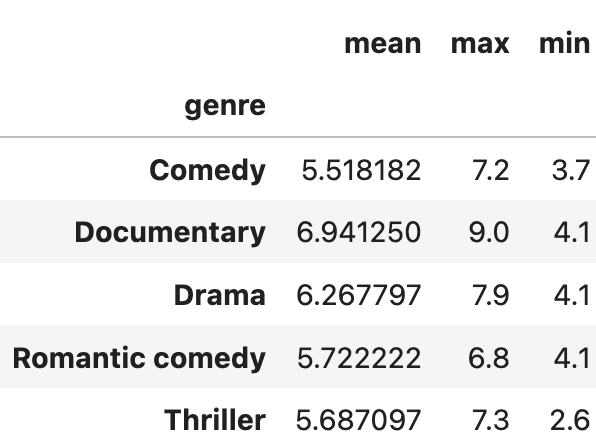
--> 리스트를 이용하면 됨.
- 변수 별로 연산을 다르게 할 수도 있음.
netflix_df.groupby('genre').agg({'score' : 'mean', 'runtime' : ['min', 'max']})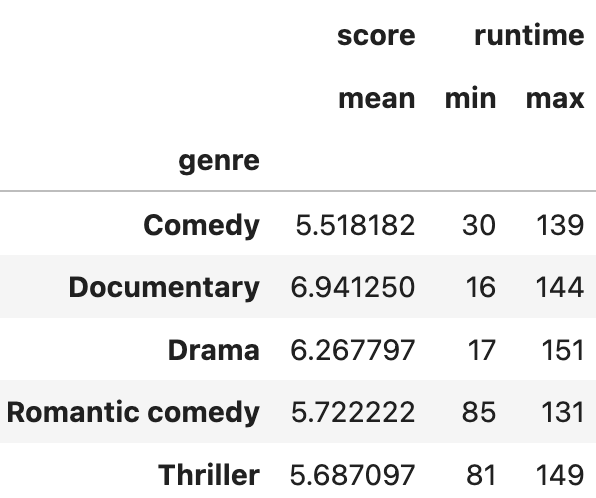
--> 딕셔너리랑 리스트를 활용하면 됨.
'Data Science > Pandas' 카테고리의 다른 글
| [데이터 전처리] 원하는 시간 간격으로 묶기 .resample() (0) | 2024.06.26 |
|---|---|
| [데이터 전처리] 피벗 테이블 .pivot_table() (2) | 2024.06.26 |
| [데이터 전처리] 데이터 합치기) 같은 형식 concat() / 칼럼 기준 merge() / 인덱스 기준 join() (0) | 2024.06.25 |
| [데이터 전처리] 날짜와 시간 데이터 인덱싱하기/ 더하기 빼기, 불린 인덱싱 (0) | 2024.06.24 |
| [데이터 전처리] 날짜와 시간 데이터 타입 설정하기, datetime (0) | 2024.06.24 |